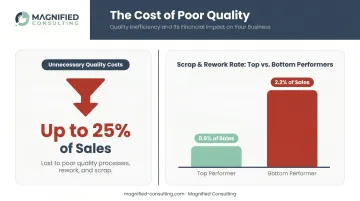
That's the central challenge of manufacturing inefficiency: it hides in plain sight. According to APQC benchmarking data, bottom-performing manufacturers spend 2.2% of sales on scrap and rework alone, compared to just 0.6% for top performers. That gap is often the difference between a profitable operation and one that's slowly bleeding margin.
This article covers the warning signs your operation needs optimization, the core strategies that deliver the highest ROI, the methodologies behind them, and how the process actually works — from initial assessment through sustained results.
Key Takeaways
- Optimization targets the entire production system — not just isolated problem areas
- Bottleneck elimination and waste reduction typically deliver the fastest, highest-leverage ROI
- Most process failures stem from poor adoption and change management, not technical shortcomings
- A well-optimized operation commands measurably higher exit value — yet most owners act on this too late
- Sustained gains require KPI tracking and ongoing oversight, not just a one-time fix
What Is Manufacturing Process Optimization?
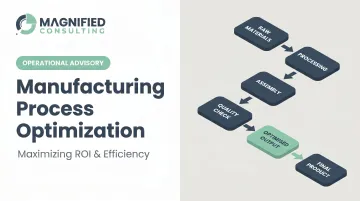
Manufacturing process optimization is a systematic evaluation of your entire production system — from raw material intake through final output — to find where time, money, and resources are being lost.
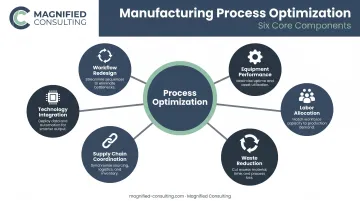
The scope goes well beyond individual fixes. It typically includes:
- Workflow redesign — restructuring how work moves through production sequences
- Equipment performance improvement — measuring and maximizing actual vs. theoretical capacity
- Labor allocation — deploying people where they add the most value
- Waste reduction — eliminating the seven classic categories of manufacturing waste
- Supply chain coordination — aligning upstream inputs with production flow
- Technology integration — using data to make better operational decisions
This applies to any size manufacturing operation, not just large enterprises. A $15M job shop faces the same categories of inefficiency as a $200M discrete manufacturer — the scale differs, but the diagnostic framework doesn't.
Reactive vs. Proactive Optimization
Most manufacturing businesses operate reactively: they fix problems after they surface. A machine breaks down, they repair it. Quality escapes spike, they add an inspection step. This approach keeps things running, but it doesn't improve them.
Proactive optimization builds systems that prevent inefficiency and drive consistent gains over time. Businesses that make this shift compound their margins over time. Those that don't tend to grind through the same problems year after year.
Warning Signs Your Manufacturing Business Is Leaving Profit on the Table
Inefficiency rarely arrives all at once. It accumulates in small, tolerated compromises until those compromises define how the business runs. By the time the impact shows up in your financials, the root causes have often been invisible for years.
Operational Red Flags
- Consistently missed production targets, even with adequate equipment and staffing
- High scrap or rework rates that teams treat as unavoidable
- Frequent unplanned equipment downtime — Plant Engineering's maintenance survey found aging equipment was the leading cause of unscheduled downtime for 44% of manufacturers
- Labor costs rising without a corresponding increase in output
Operational cracks like these almost always show up downstream in your numbers. Watch for these financial warning signs as well:
Financial Red Flags
- Shrinking profit margins despite steady or growing revenue
- Difficulty scaling production without proportionally growing headcount
- Cash flow problems tied to production delays or excess inventory buildup
- Capital expenditure requests for new equipment when existing equipment isn't fully utilized
If two or more of these patterns apply, the problem is process inefficiency, not market conditions or pricing.
Core Strategies to Optimize Your Manufacturing Process
Bottleneck Identification and Elimination
A bottleneck is the single point in your production process that limits overall throughput. It might be a machine with limited capacity, a workflow sequence that creates queuing, or a skilled labor constraint at a critical station. Whatever the cause, every other improvement in your operation is throttled by that constraint.
Identifying bottlenecks through production data analysis is the highest-leverage starting point in any optimization engagement. Resolving even one critical bottleneck can have an outsized impact on capacity and output without adding equipment or headcount.
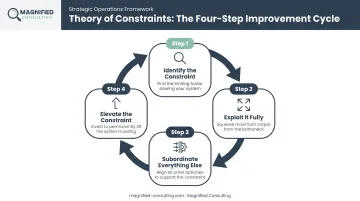
The Theory of Constraints provides a structured approach: identify the constraint, exploit it fully before making other changes, subordinate everything else to supporting it, then elevate it if needed. Repeat. Applied consistently, it produces measurable throughput gains without requiring new capital investment.
Waste Reduction Across the Value Stream
The Lean Enterprise Institute identifies seven classic categories of manufacturing waste: overproduction, waiting, transport, overprocessing, inventory, motion, and defects. Overproduction is considered the worst — it drives all the others.
A structured value stream audit reveals where these wastes are occurring and, more usefully, what they're costing the business annually. Waste stops being an abstract concept when it has a dollar figure attached.
The performance gap between top and bottom performers on scrap and rework — 0.6% vs. 2.2% of sales — illustrates why waste reduction compounds so significantly over time. That gap also points directly to another hidden cost center: your production floor layout.
Workflow and Layout Optimization
Equipment installed reactively over years rarely sits in an arrangement that supports efficient flow. Cross-traffic, unnecessary material travel, and staging delays accumulate silently. No single step looks catastrophically inefficient, but the combined effect on throughput is substantial.
Layout changes — reconfiguring equipment to support continuous flow, implementing cellular manufacturing, applying 5S workplace organization — often improve throughput without major capital investment. Many manufacturers overlook the production floor's physical arrangement as an optimization lever, even when it's one of the most accessible ones available.
Equipment Performance and Preventive Maintenance
Overall Equipment Effectiveness (OEE) is calculated by multiplying availability × performance × quality. It tells you what percentage of planned production time is truly productive. Many manufacturing lines operate at around 60% productivity — meaning 40% of capacity is being lost to downtime, reduced speed, or quality defects.
Structured preventive maintenance programs reduce unplanned downtime and extend machinery lifespan. The goal isn't to chase a "top-quartile OEE" benchmark — it's to use OEE as an internal trend metric that shows whether your equipment is getting better or worse over time.
Labor Efficiency and Workforce Alignment
Optimization also examines whether labor is deployed where it adds the most value. This includes:
- Reducing time spent on low-value tasks that could be standardized or eliminated
- Improving changeover efficiency through structured SMED approaches
- Ensuring frontline teams have the information and skills needed to maintain process improvements
- Aligning supervision and floor leadership with new workflow expectations
Labor is often the most expensive variable in a manufacturing operation. How it's allocated matters as much as how much of it you have.
How Process Optimization Directly Maximizes ROI
The Cost Reduction Pathway
When waste is eliminated and workflows are tightened, operational costs fall directly. This includes reduced material waste, lower energy consumption, less rework and scrap, and better utilization of existing assets — without requiring new capital spending.
NIST's Manufacturing Extension Partnership reported $2.6 billion in cost savings for clients in FY2024 alone, alongside $15 billion in new and retained sales and 108,000+ jobs created or retained. These are aggregate outcomes across manufacturers of varying sizes, and they reflect what systematic process improvement actually delivers at scale.
The Throughput-Revenue Connection
Optimization increases the volume of saleable output that can be produced within the same footprint and headcount. Revenue grows without a proportional increase in fixed costs. That's the core ROI lever in manufacturing: producing more from the resources already in place.
Quality and Consistency ROI
Fewer defects mean lower warranty and rework costs, fewer customer complaints, and stronger customer retention. Quality improvements compound over time as the business builds a reputation for reliability. ASQ notes that unnecessary quality expenses can cost as much as 25% of sales — which means even modest quality improvements translate directly into margin recovery.
Capacity Expansion ROI
Many manufacturing businesses invest in new equipment or facility expansion when the real constraint is process inefficiency. Optimizing first can delay or eliminate capital expenditures that would otherwise seem inevitable. That deferred capital, kept on the balance sheet rather than tied up in equipment, has a meaningful impact on cash flow and business valuation.
Business Value and Exit Readiness
For privately owned and family-run manufacturing businesses, a well-optimized operation is significantly more valuable at exit. Documented processes, strong margins, and stable performance are precisely what acquirers pay premiums for. At Magnified Consulting, we treat operational efficiency and exit readiness as two sides of the same coin — improvement work that builds the margins and process documentation that make a business attractive to acquirers.
Proven Methodologies Used in Manufacturing Process Optimization
Lean Manufacturing
Lean centers on eliminating non-value-adding activities and pursuing continuous improvement through Kaizen. It's particularly effective for reducing lead times and waste in production-heavy environments.
Modern Lean applications must account for higher SKU variability and frequent changeovers — realities that have made flexible cell design and rapid changeover capability (SMED) increasingly central to Lean implementation. One important caveat: a 2022 study of 50 North American manufacturing organizations found that about 70% had attempted Lean, but only one in four reported satisfactory results. The methodology isn't the failure point — adoption and culture are.
Six Sigma
Six Sigma uses data and statistical analysis to identify and reduce variation in manufacturing processes. Its numerical target — 3.4 defects per million opportunities — reflects a focus on near-elimination of process variation, not just improvement.
Six Sigma works best in tandem with Lean — forming Lean Six Sigma — for businesses looking to address both speed and quality simultaneously. Lean targets flow and waste; Six Sigma targets variation and defects. Together, they cover the full spectrum of production inefficiency.
Value Stream Mapping
Value Stream Mapping visually diagrams every step in the flow of materials and information through a production process — from order to delivery. It makes waste and delays visible in a format that resonates with both operational teams and business owners.
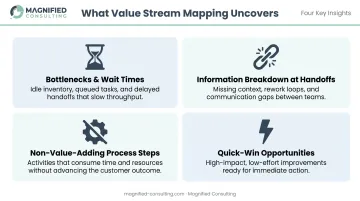
Its primary value is as a prioritization tool: it shows where optimization efforts will deliver the fastest return. A VSM exercise typically surfaces:
- Bottlenecks and wait times that internal teams have normalized over time
- Handoff points where information breaks down between departments
- Process steps that consume resources without adding customer value
- Quick-win opportunities that can be addressed before a full optimization plan is built
For many manufacturers, that clarity arrives in the first few weeks — faster than months of internal analysis typically deliver.
How the Optimization Process Works: From Assessment to Results
Initial Assessment and Baseline Measurement
A structured optimization engagement begins with a thorough assessment: gathering production data, observing workflows, interviewing team members across functions, and establishing a performance baseline. Without that baseline, it's impossible to prove ROI — or to know whether improvements are holding.
This phase is diagnostic, not prescriptive. The goal is to understand the operation as it actually functions, not as it appears on paper.
Identifying Priorities and Designing Solutions
Assessment findings are analyzed to rank improvement opportunities by impact and feasibility. High-impact, high-feasibility changes get addressed first. This sequencing matters — early wins build organizational confidence and free up resources for deeper structural work.
Solutions are designed around the specific constraints of a business's production environment, workforce, and financial position. A strategy built for someone else's operation rarely holds up under the pressures of yours.
Implementation and Change Management
Process changes fail most often not because of technical flaws, but because of poor adoption. Lean implementation failure rates in organizational improvement programs are estimated at 60% to 90% in SME research — a sobering figure that underscores why change management is as critical as process design.
Effective implementation requires:
- Clear communication of the "why" before changes reach the floor
- Targeted training matched to each team's role in the new process
- Leadership alignment secured ahead of rollout — not during it
- Frontline supervisors involved in design, not just execution
Magnified Consulting builds this into every engagement — embedding with client teams during rollout, coordinating people and process changes in sequence, and measuring adoption as a concrete outcome alongside production metrics.
Monitoring, Measuring, and Sustaining Gains
KPI tracking systems allow business owners to see whether optimization changes are holding and where further refinement is needed. The best consulting relationships include ongoing support: regular performance monitoring, strategy adjustments as the data evolves, and a continuous improvement culture that compounds gains rather than letting them quietly revert.
That sustained support is where the real ROI is built. For manufacturing businesses generating $10M+ in revenue, Magnified Consulting pairs initial strategy work with long-term mentorship — with documented outcomes that include meaningful reductions in production times and measurable profitability gains within the first six months.
Frequently Asked Questions
What do manufacturing consultants charge?
Fees vary based on scope, engagement length, and experience level, with structures ranging from project-based flat rates to monthly retainers. The more useful frame is ROI: a qualified consultant who delivers measurable cost reductions or throughput gains should return multiples of their fee within the first engagement.
What is manufacturing process optimization?
It's the systematic analysis and improvement of production workflows, equipment use, labor allocation, and resource management. The goal is to reduce waste, lower costs, and increase output across the entire production system, not just isolated problem areas.
How long does it take to see ROI from manufacturing process optimization?
Targeted improvements in high-priority areas — bottleneck resolution, scrap reduction, layout changes — can produce measurable results within the first few months. Broader operational transformations typically take 6–12 months to fully reflect in financial performance.
What are the most common inefficiencies in manufacturing operations?
The most frequently identified culprits include:
- Unplanned equipment downtime
- Excessive changeover times
- High scrap and rework rates
- Inefficient floor layout
- Labor deployed on low-value tasks that could be standardized or eliminated
How do I know if my manufacturing business needs process optimization?
If margins are shrinking, capacity feels capped despite adequate equipment, or scaling requires more headcount than the revenue increase justifies, those are strong indicators that process inefficiencies are limiting the business's potential.
What is the difference between Lean and Six Sigma in manufacturing?
Lean focuses on eliminating waste and accelerating flow. Six Sigma focuses on reducing variation and improving quality through data analysis. Most manufacturers benefit from combining both: Lean Six Sigma addresses speed and quality simultaneously.